Biology & ecology · Updated June 2026
Learn Ecology & Population Growth with AI Safely
Master exponential and logistic growth curves, carrying capacity, and predator-prey dynamics using Socratic AI coaching to analyze ecological datasets safely.
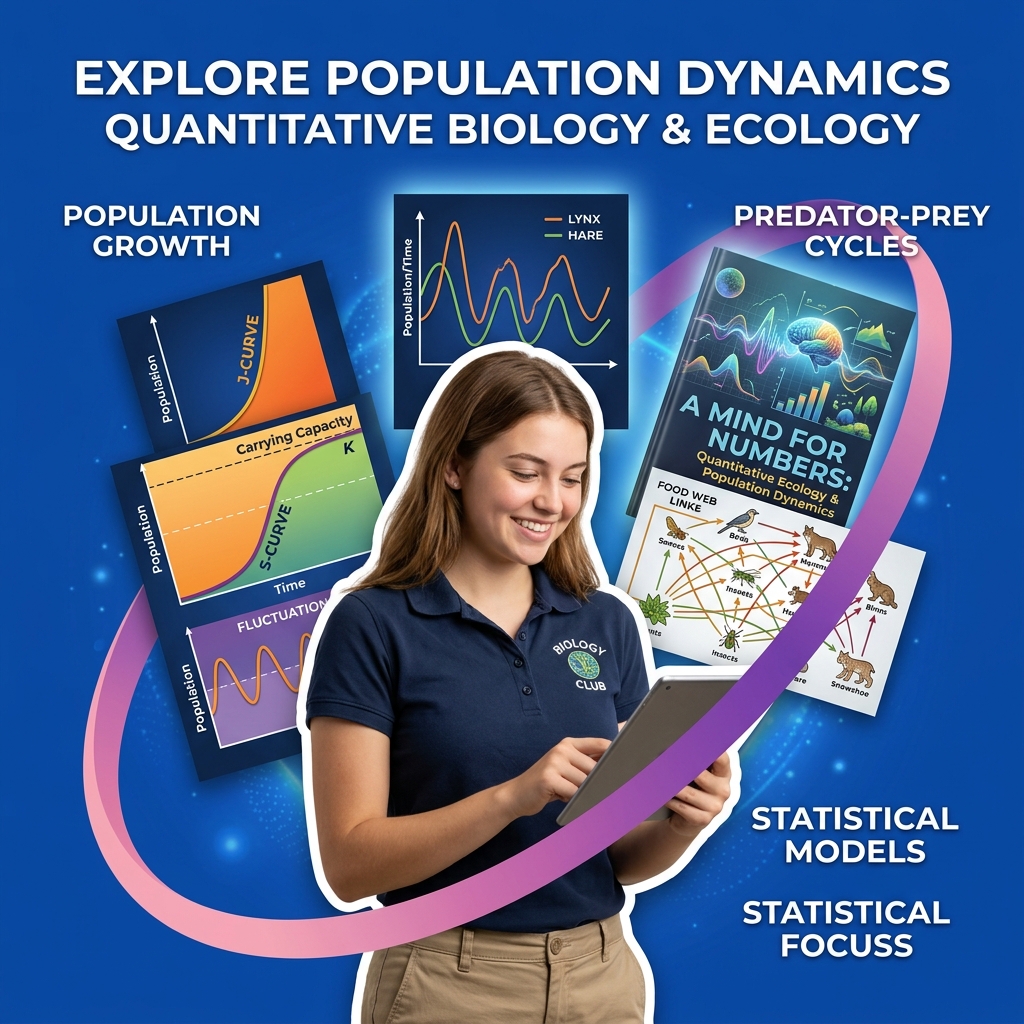
In general biology, environmental science, and ecology, population ecology is the study of how populations of a species change over time and interact with their environments. Understanding these dynamics is essential for conservation biology, resource management, and predicting the impacts of climate change. The core mathematical models used in ecology are growth models: exponential growth (which occurs under unlimited resources) and logistic growth (which accounts for environmental limits and carrying capacity). Beyond single-species growth, ecologists study multi-species interactions, famously modeled by the Lotka-Volterra predator-prey equations.
Because analyzing growth datasets, calculating carrying capacities, and graphing oscillating predator-prey cycles are mathematically complex, students often paste ecological datasets or word problems into AI models and ask them to compute population projections or draw food webs. However, letting AI solve these equations for you bypasses the mathematical modeling and system-level thinking required to design conservation plans, analyze wildlife surveys, or pass biology and ecology exams. This guide outlines a safe, Socratic study workflow to use AI as an ecology and population growth coach.
Step 1: Differentiating Exponential and Logistic Growth Models Socraticly
Ecology uses two primary curves to model how a population size \(N\) changes over time \(t\):
- Exponential Growth (J-curve): Occurs when resources are unlimited. The rate of growth is proportional to the population size:
\[\frac{dN}{dt} = rN\]
where \(r\) is the per capita growth rate.
- Logistic Growth (S-curve): Accounts for resource limits by introducing carrying capacity (\(K\))—the maximum population size the environment can sustain. The growth rate slows down as the population approaches \(K\):
\[\frac{dN}{dt} = rN\left(1 - \frac{N}{K}\right)\]
Use this prompt to check your growth model logic Socraticly:
I am comparing exponential and logistic growth models for a population of deer. I want to explain why the growth rate dN/dt in the logistic model changes as N approaches K. Act as a Socratic ecology tutor. Do not write the equations or explain the curves. Ask me to identify the mathematical term (1 - N/K) value when N is very small compared to K, ask me what happens to this term when N equals K, and have me explain what this implies about the growth rate at those points. Guide me.Step 2: Calculating Carrying Capacity and Limiting Factors
Calculating carrying capacity requires analyzing how density-dependent limiting factors (like food availability, nesting space, or disease transmission) impact birth and death rates. In logistic models, the population grows fastest when it is at exactly half its carrying capacity ($N = K/2$), known as the point of maximum sustainable yield.
Practice carrying capacity calculations Socraticly with this prompt:
I am solving an ecology problem where a population of yeast grows logistically with a growth rate r = 0.2 hour^-1 and carrying capacity K = 1000 cells. The current population is 800 cells. Act as a Socratic biology coach. Do not compute the growth rate dN/dt. Ask me to write the logistic growth equation, identify the current ratio of N/K, and guide me through substituting these values to find the rate of change. Guide me step-by-step.Step 3: Modeling Predator-Prey Dynamics Socraticly
In multi-species systems, predator and prey populations exhibit coupled oscillations: an increase in prey leads to an increase in predators, which then consumes the prey, causing the prey population to crash, followed by a predator crash. These dynamics are represented by the Lotka-Volterra equations:
- Prey growth: \(\frac{dx}{dt} = \alpha x - \beta x y\)
- Predator growth: \(\frac{dy}{dt} = \delta x y - \gamma y\)
where \(x\) is prey, \(y\) is predators, and \(\alpha, \beta, \gamma, \delta\) are interaction parameters.
Check your predator-prey oscillation logic Socraticly using this prompt:
I am studying the Lotka-Volterra predator-prey equations. I want to explain why the predator population peak lag behind the prey population peak on a population-vs-time graph. Act as a Socratic ecology instructor. Do not write out the solution or explain the cycles. Ask me to analyze the prey growth equation when predator population y is low, explain what happens to predator growth dy/dt when prey x is abundant, and have me trace the cause-and-effect loop. Guide me.
A Mind for Numbers: How to Excel at Math and Science
Dr. Barbara Oakley's actionable guide to unlocking analytical thinking. Perfect for students tackling STEM classes who want to beat procrastination and master complex formulas.
AI Study Pilot receives a small commission from qualifying Amazon purchases at no extra cost to you.Common mistakes
Keep these typical ecology pitfalls in mind:
- Confusing per capita growth rate (\(r\)) with overall growth rate (\(dN/dt\)): The per capita rate \(r\) is the change per individual, while \(dN/dt\) is the change in the total population size. In exponential growth, \(r\) is constant, but \(dN/dt\) increases rapidly as the population grows.
- Ignoring time lags: Simple logistic equations assume the population reacts instantly to resource changes. In reality, there is a time lag between mating and birth, which causes populations to overshoot carrying capacity ($N > K$), deplete resources, and experience a population crash.
- Underestimating density-independent factors: Density-independent factors (like hurricanes, droughts, or forest fires) affect population size regardless of density, whereas density-dependent factors (like competition or predation) become stronger as density increases. AI tools often focus exclusively on density-dependent math.
FAQ
- What are r-selected and K-selected species? Species are categorized by their reproductive strategies:
- r-selected species: Adapted to unstable environments, reproduce rapidly, have many offspring, small body size, and low parental care (e.g., bacteria, insects, weeds).
- K-selected species: Adapted to stable environments, compete effectively near carrying capacity, reproduce slowly, have few offspring, large body size, and high parental care (e.g., elephants, humans, oak trees).
Prompt: "Socraticly quiz me on the ecological trade-offs between r-selection and K-selection strategies and ask me to classify given species."
- What is a trophic cascade? A trophic cascade occurs when predators in a food web suppress the abundance or alter the behavior of their prey, thereby releasing the next lower trophic level from predation (or herbivory). Prompt: "Socraticly quiz me on the classic case of reintroducing wolves to Yellowstone National Park and how this triggered a trophic cascade down to the primary producers. Guide me."
- What is the competitive exclusion principle? Also known as Gause's law, it states that two species competing for the exact same limiting resource cannot coexist at constant population values if other ecological factors remain constant; one will eventually outcompete the other. Prompt: "Socraticly quiz me on how paramecium laboratory experiments demonstrated competitive exclusion, and ask me to explain how resource partitioning allows species to coexist."
Final recommendation
Ecology is the study of system interdependencies. Do not rely on AI solvers to calculate your growth rates or outline your food webs. Instead, sketch your J-curves and S-curves on paper, analyze predator-prey feedback loops step-by-step, and leverage Socratic AI prompt sessions to audit your logistic variables, carrying capacity bounds, and competitive interactions.
Disclosure: AI Study Pilot may add affiliate links later. We recommend free-first tools where possible and never promise guaranteed grades or outcomes.