Economics & statistics · Updated June 2026
Learn Econometrics & Regression Analysis with AI Safely
Master linear regression, hypothesis testing, multicollinearity, and heteroskedasticity using Socratic AI prompting to learn econometrics safely.

In economics, business, and social sciences, econometrics is the application of statistical methods to economic data in order to give empirical content to economic relationships. More simply, it is the tool used to test economic theories, estimate policy effects, and forecast trends. The core method of econometrics is regression analysis, specifically Ordinary Least Squares (OLS) estimation, which fits a line of best fit through data points by minimizing the sum of squared residuals. Understanding regression models allows us to estimate the causal impact of one variable (like years of schooling) on another (like hourly wage).
Because running regressions involves software coding (in R, Stata, or Python) and interpreting large statistical output tables, students often copy their entire regression datasets or output summary printouts into AI models and ask them to explain the results or write the interpretation report. However, letting AI interpret your regression tables or write your analysis drafts prevents you from developing the critical statistical intuition needed to detect bias, identify confounding variables, or defend your empirical research. This guide outlines a safe, Socratic study workflow to use AI as an econometrics and regression analysis coach.
Step 1: Understanding OLS Assumptions Socraticly
To ensure that OLS estimators are Unbiased and the Best Linear Unbiased Estimators (BLUE), the Gauss-Markov assumptions must hold:
- Linear in Parameters: The population model is \(Y = \beta_0 + \beta_1 X_1 + \dots + \beta_k X_k + u\).
- Random Sampling: The data is obtained through a random sample of the population.
- No Perfect Collinearity: None of the independent variables is constant or a perfect linear combination of others.
- Zero Conditional Mean: The error term \(u\) has an expected value of zero given any values of the independent variables: \(E(u \mid X_1, \dots, X_k) = 0\).
- Homoskedasticity: The error term has constant variance: \(Var(u \mid X) = \sigma^2\).
The Zero Conditional Mean assumption is the most critical for establishing causality. If omitted variables are correlated with both \(Y\) and \(X\), this assumption is violated, causing omitted variable bias.
Use this prompt to check your OLS assumption logic Socraticly:
I am estimating a regression of wage (Y) on education level (X). I want to analyze if the Zero Conditional Mean assumption is violated due to the omitted variable 'ability'. Act as a Socratic econometrics tutor. Do not explain the answer. Ask me to define what the error term u represents, ask whether 'ability' is correlated with education, and guide me to determine if the OLS slope coefficient beta_1 will over- or underestimate the true causal effect of education.Step 2: Interpreting Regression Coefficients and Significance Socraticly
A standard regression output yields coefficients (\(\hat{\beta}\)), standard errors (\(SE\)), \(t\)-statistics, \(p\)-values, and \(R^2\). The \(t\)-statistic is computed as:
\[t = \frac{\hat{\beta} - \beta_{\text{hypothesized}}}{SE}\]
We compare the \(t\)-statistic to critical values or check if the \(p\)-value is less than our significance level (typically \(0.05\)) to reject the null hypothesis \(H_0: \beta_1 = 0\) (no effect).
Use this prompt to practice interpreting a regression table Socraticly:
I have a regression output where the dependent variable is house price (in thousands of dollars) and the independent variable is square footage. The slope coefficient beta_1 is 0.15 with a standard error of 0.05 and a p-value of 0.003. Act as a Socratic statistics coach. Do not write the interpretation or state if it is significant. Ask me to interpret the value 0.15 in plain terms, ask me how to state the null hypothesis, and have me explain what the p-value of 0.003 implies about the null hypothesis. Guide me step-by-step.Step 3: Diagnosing Violations (Heteroskedasticity and Multicollinearity)
If OLS assumptions are violated, your results can be misleading:
- Heteroskedasticity: Standard errors are biased, meaning your \(t\)-statistics and hypothesis tests are invalid. You must use robust standard errors to correct this.
- Multicollinearity: High correlation between independent variables inflates the variance of coefficients, making them highly sensitive to small changes and difficult to identify individual effects.
Use this prompt to diagnose these issues Socraticly:
I suspect my regression model has heteroskedasticity because the variance of my residuals seems to increase with the scale of the independent variable. Act as a Socratic econometrics coach. Do not tell me how to run tests or what models to use. Ask me what graphical plot I can generate to inspect this visually, ask me to name a statistical test used to detect heteroskedasticity, and ask how using 'heteroskedasticity-robust standard errors' changes my regression coefficients and significance tests.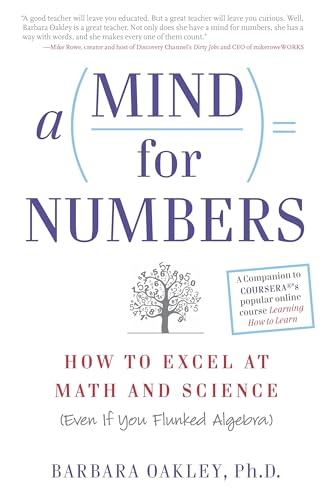
A Mind for Numbers: How to Excel at Math and Science
Dr. Barbara Oakley's actionable guide to unlocking analytical thinking. Perfect for students tackling STEM classes who want to beat procrastination and master complex formulas.
AI Study Pilot receives a small commission from qualifying Amazon purchases at no extra cost to you.Common mistakes
Keep these typical econometrics pitfalls in mind:
- Confusing Correlation with Causation: Finding a statistically significant coefficient \(\beta_1\) does not prove that \(X\) causes \(Y\). Confounding variables, reverse causality, or selection bias may be present. Always check your model's causal validity.
- Misinterpreting the R-squared: A high \(R^2\) indicates that a large percentage of the variance in \(Y\) is explained by the model, but it does not mean the model is good or that the coefficients are unbiased. Conversely, a low \(R^2\) can still yield highly reliable causal estimates.
- Dummy Variable Trap: When representing \(M\) categories with binary (dummy) variables, you must include only \(M-1\) dummies to avoid perfect collinearity. Including all \(M\) dummies alongside an intercept causes the regression software to crash or drop one automatically.
FAQ
- What is the difference between R-squared and Adjusted R-squared? \(R^2\) always increases or stays constant when you add more independent variables, even if they are irrelevant. Adjusted \(R^2\) penalizes you for adding variables that do not improve the model's predictive power.
Prompt: "Socraticly quiz me on why adding variables always increases R-squared and ask me to write down the formula for adjusted R-squared to explain the penalty term."
- What is endogeneity? Endogeneity occurs when an independent variable is correlated with the error term \(u\). This can be caused by omitted variables, measurement error, or simultaneous causality, rendering OLS estimators biased and inconsistent.
Prompt: "Socraticly quiz me on what causes endogeneity and ask how Instrumental Variables (IV) can be used to resolve it. Guide me."
- What is a log-log regression model? A model where both the dependent and independent variables are log-transformed (\(\ln(Y) = \beta_0 + \beta_1 \ln(X) + u\)). In this model, the coefficient \(\beta_1\) is interpreted as an elasticity: a 1% change in \(X\) is associated with a \(\beta_1\)% change in \(Y\).
Prompt: "Socraticly quiz me on the interpretations of slope coefficients in log-level, level-log, and log-log regression models. Guide me."
Final recommendation
Econometrics is about validating models, not just fitting lines. Do not ask AI to interpret your coefficients or clean your datasets. Instead, check your Gauss-Markov assumptions manually, plot your residuals to check for constant variance, and leverage Socratic AI prompt sessions to audit your standard error robust treatments, omitted variable controls, and dummy variable structures.
Disclosure: AI Study Pilot may add affiliate links later. We recommend free-first tools where possible and never promise guaranteed grades or outcomes.