STEM writing · Updated May 2026
How to Write STEM Lab Reports with AI Support
Learn a safe, source-grounded AI workflow to structure science lab reports, draft methodologies, and analyze error margins without cheating.

Writing lab reports is a central requirement in college-level STEM (Science, Technology, Engineering, and Math) classes. A standard report demands a strict format, detailing your introduction, materials and methods, raw data results, and a comprehensive discussion of error margins.
AI assistants can streamline the report-writing process by suggesting structured templates, polishing your scientific tone, and identifying potential sources of experimental error.
However, letting an AI write your lab discussion or fabricate data is a severe violation of academic integrity. If the data trends do not match your actual laboratory outcomes, recruiters and grading assistants will quickly flag the report. The key is to use AI to help you organize and refine your report, while writing the results and analysis yourself.
STEM lab report workflow with AI
- Compile your raw measurements: Collect all data, formulas, and observations from your laboratory session.
- Generate a structured report skeleton: Ask the AI to write a standard scientific template matching your specific class criteria.
- Draft the methodology section: Detail the step-by-step procedure of your experiment, refining for scientific precision.
- Analyze error sources and margins: Prompt the AI to suggest potential reasons for discrepancy between your results and theoretical values.
- Keep physical lab sketches digitized: Capture diagrams of your physical lab equipment setups on paper first to keep a clear audit trail.
Scanning and digitizing laboratory diagrams
Science experiments require sketching physical layouts, circuit diagrams, or chemical reactions. Drawing these on computer software during lab work is slow and distracting.
Using a smart reusable notebook (like the Rocketbook Smart Reusable Notebook) during your lab session allows you to sketch circuit paths or chemical apparatus configurations quickly by hand. You can then scan your sketches to the cloud to reference them directly when writing the methods and results sections of your report.
Step 1 — Run the "Lab Report Skeleton" prompt
To format your report professionally, do not write free-form. Use this prompt to generate a custom template based on your experiment:
Act as a scientific writing coach. I am writing a college-level [e.g., Physics] lab report about [Experiment Topic, e.g., measuring gravitational acceleration using a simple pendulum].

Generate a structured outline template detailing what specific information I must include under these standard sections:
1. Abstract (Brief summary of goals and final numerical outcomes).
2. Introduction (Theoretical background and formulas).
3. Materials and Methods (List of equipment and setup steps).
4. Results (How to present the data table and calculations).
5. Discussion and Conclusion (Analyzing error sources).
This structures your draft, ensuring you do not miss required sections.
Step 2 — Refine the methods description
To make your procedure section read professionally, paste your raw lab notes and ask the AI to polish the syntax:
Rewrite this raw procedure list into a formal, passive-voice "Materials and Methods" paragraph suitable for a scientific report. Keep the tone objective and precise.

Raw Procedure Notes:
[Paste raw notes, e.g., "We hung the mass, swung it 10 times, timed it with a stopwatch, and repeated with different string lengths."]
Passive voice (e.g., "The mass was suspended, and the period of ten oscillations was recorded...") is standard in scientific writing.
Step 3 — Brainstorm error sources
If your experimental results do not match the theoretical values, use this prompt to identify potential sources of systematic or random error:
In my experiment to measure [e.g., gravity with a pendulum], my average calculated value was [e.g., 9.5 m/s^2], compared to the theoretical value of [e.g., 9.8 m/s^2]. Without writing the paragraphs for me, list 4 potential physical sources of systematic or random error in this pendulum setup that could explain this lower value.This helps you write a thoughtful discussion section explaining the variance in your data.
Common lab report mistakes to avoid
* Fabricating data trends: Never edit your raw laboratory measurements to match the theoretical value. Science is about explaining experimental variance, and instructors look for real, messy data.
* Letting AI explain results blindly: Do not ask AI to explain your data trend. You must analyze your own numbers and draw your own scientific conclusions.
* Skipping unit analysis: Ensure all data tables contain clear units (e.g., kilograms, seconds, meters) in the headers. AI models frequently omit or mix up metric units.
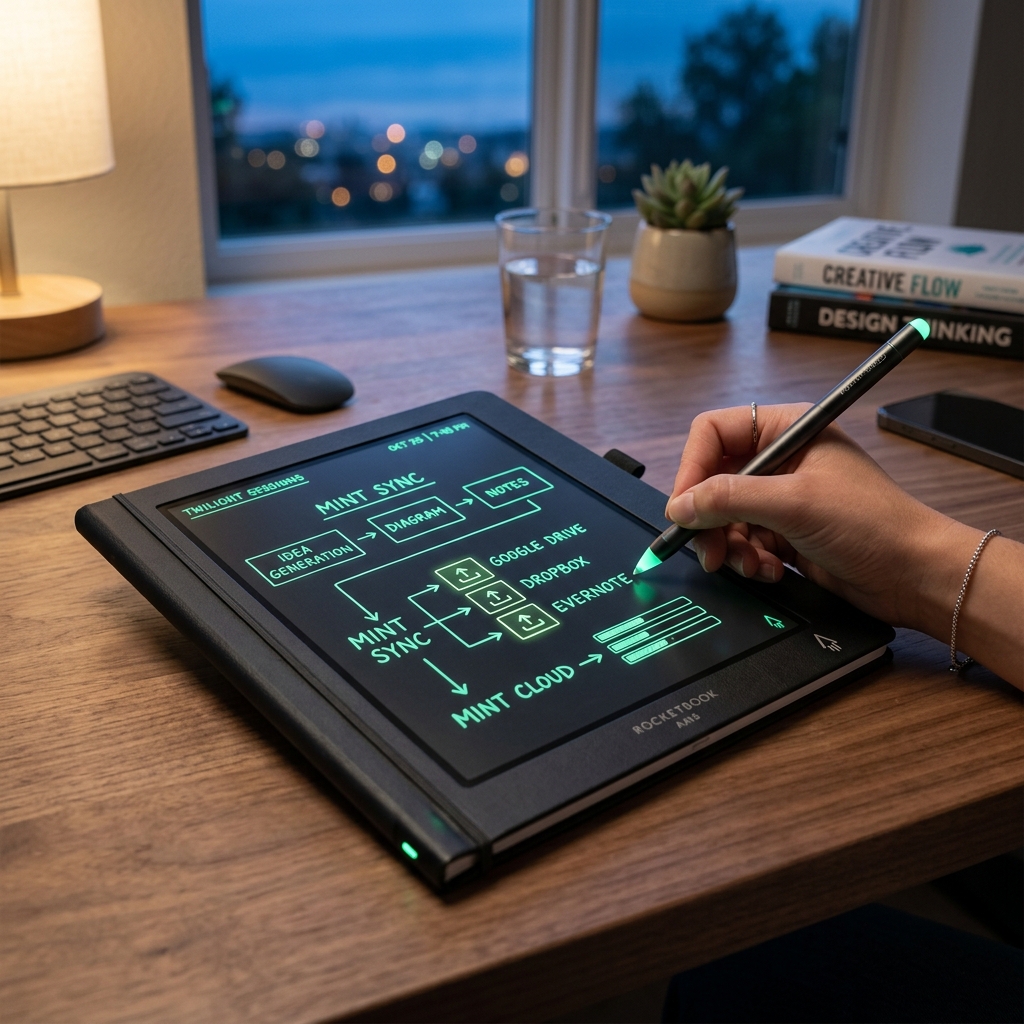
Rocketbook Smart Reusable Notebook
Eco-friendly, reusable physical notebook that digitizes and syncs your hand-written diagrams and notes directly to your favorite cloud storage for AI-assisted study.
AI Study Pilot receives a small commission from qualifying Amazon purchases at no extra cost to you.Disclosure: AI Study Pilot may add affiliate links later. We recommend free-first tools where possible and never promise guaranteed grades or outcomes.