Social science · Updated June 2026
How to Learn College Economics and Master Micro/Macro Graphs With AI Safely
Learn how to use AI safely to master micro and macroeconomics graphs, understand shifts vs. movements, and analyze market equilibriums conceptually.
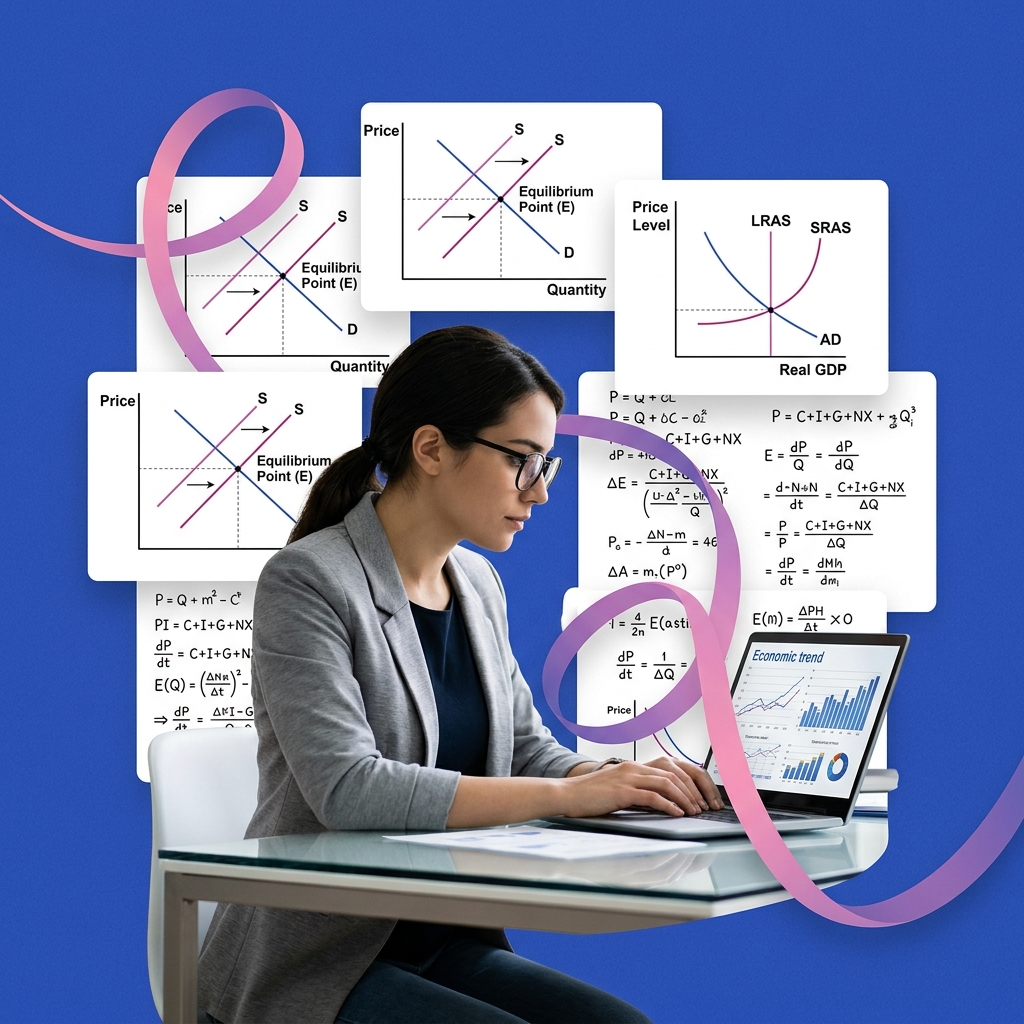
Introductory microeconomics and macroeconomics are core requirements for all business, finance, management, and political science majors. However, many students struggle with the transition from qualitative reading to the graphical and mathematical modeling that defines college-level economics.
The biggest pitfall is treating economics like a history class by attempting to memorize definitions. Economics exams test your ability to predict how changes in policy, consumer taste, or technology affect market equilibrium. You must be able to represent these changes visually by shifting curves on a graph and calculating values like elasticity, consumer surplus, and deadweight loss.
AI models are exceptionally good at explaining economic intuition, breaking down mathematical formulas, and generating practice graph-shifting scenarios. You can use an AI as a personalized economics tutor to explain the logic behind shifts, guide you through elasticity calculations, and quiz you on macroeconomic policies.
However, using AI to write your economic policy analyses or copying pre-balanced graphs for your course assignments is a violation of academic integrity. The key is to use the AI to build your conceptual understanding and practice graphical reasoning, while drawing the graphs and performing the mathematical calculations yourself.
Conceptual economics workflow with AI
- Differentiate shifts from movements: Master what causes a curve to shift versus what causes a movement along a curve.
- Track market adjustments step-by-step: Use AI to trace the chain reaction from an initial market shock to the final equilibrium.
- Deconstruct mathematical formulas: Review the intuition behind equations (such as elasticity or marginal utility) before calculating.
- Practice graph-drawing active recall: Sketch curve shifts by hand and explain the economic logic in your own words.
Avoiding the Illusion of Competence in Graphical Modeling
In economics, looking at a completed graph in a textbook makes perfect sense. The lines cross, the shaded areas represent surplus, and the arrows point to the new equilibrium. This visual clarity creates a powerful "illusion of competence." You believe you understand the model because you can follow the textbook's logic.
In A Mind for Numbers: How to Excel at Math and Science, Dr. Barbara Oakley explains that true understanding only comes when you retrieve and build the concepts yourself.
To study economics graphs effectively, you must practice drawing them on a blank page without looking at your reference materials. Use an AI assistant to generate a market shock scenario. Before looking at any answers, draw the initial supply and demand curves, apply the shift, label the new equilibrium price and quantity, and shade the consumer surplus. Once you have drawn the model, ask the AI to describe the resulting shifts and coordinates step-by-step to audit your own drawing.
The Graph-Shifting logic Prompt
To master the step-by-step economic adjustments that occur when a market experiences a shock, use this prompt:
Act as a college economics professor. Explain the market adjustments that occur when [insert scenario, e.g., a new agricultural technology increases crop yields] conceptually.

Please generate a study guide:
1. Identify which curve shifts (Supply or Demand) and explain the underlying economic reason for the shift.
2. Describe whether the curve shifts to the right (increase) or left (decrease).
3. Trace the step-by-step adjustment process from the initial equilibrium, through the temporary shortage or surplus, to the new equilibrium.
4. Explain what happens to the final equilibrium price and equilibrium quantity.
5. Provide 3 mock market shock scenarios for me to practice shifting curves.
Step-by-Step Economics Review
Step 1 — Master elasticity calculations
Elasticity formulas can look intimidating. Ask the AI to explain the conceptual intuition behind the numbers:
Explain what price elasticity of demand actually measures conceptually. If a company calculates its price elasticity of demand to be -1.5, what does that mean for their pricing strategy if they want to increase total revenue?Step 2 — Parse macroeconomic policy graphs
Macroeconomics involves tracking aggregate supply and demand curves (AD-AS) or monetary policy curves (IS-LM). Ask the AI to help you trace policy shocks:
A central bank decides to raise the reserve requirement for commercial banks. Explain the chain reaction of this monetary policy from the money market to the AD-AS model. Which curves shift, and how does this affect GDP and inflation?Step 3 — Quiz your double-shifting logic
Exams often include questions where both supply and demand shift simultaneously, leading to indeterminate outcomes. Ask the AI to quiz you:
Provide a double-shifting market scenario (where both supply and demand shift). Ask me to determine if the final equilibrium price and quantity increase, decrease, or are indeterminate. I will reply, and you will evaluate my logic.
A Mind for Numbers: How to Excel at Math and Science
Dr. Barbara Oakley's actionable guide to unlocking analytical thinking. Perfect for students tackling STEM classes who want to beat procrastination and master complex formulas.
AI Study Pilot receives a small commission from qualifying Amazon purchases at no extra cost to you.Common mistakes
* Shifting the wrong curve: Never shift a curve without identifying the underlying determinant (e.g., changes in income shift demand; changes in input costs shift supply).
Confusing movement and shifts: Remember that a change in the price of the good itself only* causes a movement along the existing curve, never a shift. Ask AI to clarify this distinction if you get confused.
* Letting AI draw your assignments: If your coursework requires submitting a graph, draw it yourself. Use AI to review similar scenarios, but make sure the final submission is your own hand-drawn or plotted work.
Disclosure: AI Study Pilot may add affiliate links later. We recommend free-first tools where possible and never promise guaranteed grades or outcomes.