STEM study · Updated June 2026
How to Learn College Statistics and Parse Data Analysis Workflows With AI Safely
Learn how to use AI safely to master hypothesis testing, understand statistical assumptions, and interpret data outputs conceptually.

Statistics is the gatekeeper course for dozens of majors, including psychology, business, biology, sociology, and economics. Unlike general math classes that focus primarily on mechanical calculation, college-level statistics requires a heavy dose of conceptual reasoning. You don't just calculate a number; you must interpret what that number means in a real-world scientific context.
Simply memorizing formulas is one of the most ineffective ways to study statistics. If you do not understand the underlying assumptions of a test or what a p-value actually represents, you will struggle to apply statistics to new research scenarios.
AI models are exceptionally good at breaking down mathematical concepts, creating real-world analogies, and generating practice interpretation scenarios. You can use an AI as a personalized statistics coach to explain why we use specific tests, help you parse complex model outputs, and quiz you on statistical assumptions.
However, pasting your homework datasets into an AI to generate answers or copying pre-written analysis reports for your lab projects is a violation of academic integrity. The key is to use the AI to build your conceptual understanding and practice interpreting data, rather than letting it do the analytical work for you.
Conceptual statistics workflow with AI
- Explain the test conceptually: Ask the AI to explain the purpose and intuition behind a statistical test.
- Master the mathematical assumptions: Use AI to review when a test is valid (e.g., normality, homogeneity of variance).
- Parse model output formats: Practice reading coefficient tables and test statistics.
- Practice effortful active recall: Quiz yourself on which test to apply to randomized research scenarios.
Overcoming mathematical anxiety in statistics
Statistics courses often induce high levels of math anxiety in students who aren't STEM majors. When you see a wall of Greek symbols, your brain can enter a state of cognitive overload.
In A Mind for Numbers: How to Excel at Math and Science, Dr. Barbara Oakley describes the importance of "chunking" — building mental representations of key concepts so they occupy less working memory. Instead of trying to memorize a massive formula, focus on understanding the core concept first. Use an AI-driven visual study timer to block out 25-minute Pomodoro study intervals. Focus each block on chunking one statistical concept (such as the Central Limit Theorem or statistical power) until you can explain it to a peer in plain language without looking at your notes.
The Statistical Interpretation Prompt
To understand the intuition behind a specific statistical test and practice its application, use this structured prompt:
Act as a college statistics professor. Explain the difference between [e.g., a correlation and a simple linear regression] conceptually.

Please generate a study guide:
1. Explain the purpose of each test in plain language (no formulas yet).
2. Provide a simple, memorable real-world analogy.
3. List the core assumptions that must be met before running these tests.
4. Create a mock research scenario and provide a sample output table (coefficients, R-squared, and p-values) and ask me 3 questions to help me practice interpreting the data.
Step-by-Step Statistics Review
Step 1 — Deconstruct the output
Statistical software packages (like SPSS, R, or Stata) generate complex output matrices. Copy a small, generic summary table of a model output (e.g., a regression model output) and ask the AI:
Explain what each column (Estimate, Std. Error, t value, Pr(>|t|)) represents in this regression summary conceptually. How do I determine if a predictor is statistically significant?Step 2 — Verify statistical assumptions
Many students perform calculations without verifying if the data meets the prerequisites. Ask the AI:
What are the assumptions of a paired t-test? What diagnostic plots should I check in R to verify these assumptions before reporting results?Step 3 — Quiz your test selection skills
One of the hardest parts of statistics exams is deciding which test to use. Prompt the AI:
Provide a scenario-based multiple-choice quiz where you describe 3 different research questions. For each, ask me to select the correct statistical test (e.g., Chi-Square, Independent Samples t-test, or ANOVA) and explain my reasoning.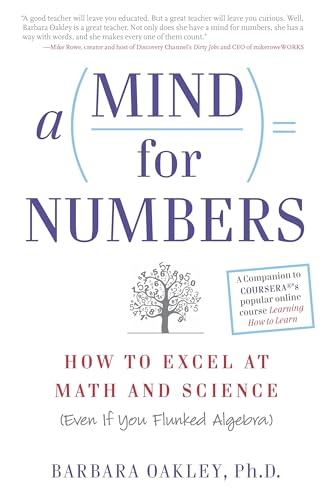
A Mind for Numbers: How to Excel at Math and Science
Dr. Barbara Oakley's actionable guide to unlocking analytical thinking. Perfect for students tackling STEM classes who want to beat procrastination and master complex formulas.
AI Study Pilot receives a small commission from qualifying Amazon purchases at no extra cost to you.Common mistakes
Focusing on calculations over interpretations: Modern software does the math; professors grade your ability to explain why* the math matters. Spend your AI study sessions practicing data interpretation, not just checking calculations.
* Treating p < 0.05 as a magic binary: AI can explain that statistical significance is not the same as practical significance. Always consider effect sizes (like Cohen's d or R-squared) in your analysis.
* Skipping manual syntax practice: If your course uses R or Python, don't let AI write your code. Use AI to debug syntax errors you encounter, but write the code line-by-line yourself to build procedural memory.
Disclosure: AI Study Pilot may add affiliate links later. We recommend free-first tools where possible and never promise guaranteed grades or outcomes.