Statistics & Data Science · Updated June 2026
Learn Hypothesis Testing and p-Values with AI Safely
Master null and alternative hypotheses, Type I and Type II errors, z-tests, t-tests, and p-value calculations using Socratic AI coaching to build statistics intuition safely.

In statistics and data science, hypothesis testing is a formal mathematical procedure that allows researchers to use sample data to draw conclusions about a larger population. At its core, hypothesis testing helps determine whether an observed effect or difference in data is statistically significant, or if it could have occurred simply by random chance.
The framework relies on two competing statements:
- Null Hypothesis (\(H_0\)): The baseline assumption that there is no effect, no difference, or no relationship between the variables being studied (e.g., \(\mu_1 = \mu_2\)).
- Alternative Hypothesis (\(H_a\)): The claim that the researcher wants to support, stating that there is a significant effect or relationship (e.g., \(\mu_1 \neq \mu_2\)).
To evaluate these statements, statisticians select a significance level (\(\alpha\), commonly \(0.05\)), calculate a test statistic (like a \(z\)-score or \(t\)-value) from the sample data, and determine the \(p\)-value—the probability of obtaining test results at least as extreme as the observed results, assuming that the null hypothesis is true. If the \(p\)-value is less than or equal to \(\alpha\), the null hypothesis is rejected.
Because calculating test statistics and looking up values in tables can feel like rote arithmetic, students frequently ask AI to run tests, compute \(p\)-values, or state whether a result is significant. However, outsourcing this math to AI prevents you from understanding the logic of statistical error rates and probability distributions. This guide outlines a Socratic workflow to utilize AI as a statistics coach to master hypothesis testing.
Step 1: Defining Hypotheses and Significance Levels Socraticly
Before running any math, a researcher must define the hypotheses and choose a significance level (\(\alpha\)). The significance level represents the threshold for rejection: it is the probability of committing a Type I error (rejecting \(H_0\) when it is actually true, or a "false positive").
- Type II error (\(\beta\)) occurs when we fail to reject \(H_0\) when it is actually false (a "false negative").
The statistical power of a test is \(1 - \beta\), the probability of correctly rejecting a false null hypothesis.
Use this prompt to check your hypothesis setup Socraticly:
I am designing a hypothesis test to determine if a new study method increases exam scores compared to the historical mean of 75. Act as a Socratic statistics tutor. Do not write the hypotheses or define error values for me. Ask me to formulate the null and alternative hypotheses, explain the difference between a one-tailed and two-tailed test in this context, and define what Type I and Type II errors would mean physically for this study. Guide me.Step 2: Choosing and Calculating Test Statistics Socraticly
The choice of test statistic depends on the population parameters:
- \(z\)-Test: Used when testing a sample mean if the population standard deviation (\(\sigma\)) is known and the sample size is large (\(n \ge 30\)). The test statistic is:
\[z = \frac{\bar{x} - \mu_0}{\sigma / \sqrt{n}}\]
- \(t\)-Test: Used when testing a sample mean if the population standard deviation (\(\sigma\)) is unknown and must be estimated using the sample standard deviation (\(s\)). The test statistic is:
\[t = \frac{\bar{x} - \mu_0}{s / \sqrt{n}}\]
with $n - 1$ degrees of freedom (\(df\)).
Using AI to solve these equations directly prevents you from learning how to set up the standard error in the denominator.
Use this prompt to master test statistic selection Socraticly:
I am analyzing a dataset with a sample size of 25, a sample mean of 80, and a sample standard deviation of 5. The population standard deviation is unknown. Act as a Socratic statistics coach. Do not calculate any scores or select the test for me. Ask me to identify which test (z or t) is appropriate here and have me explain why. Then, walk me through writing out the formula and calculating the test statistic step-by-step. Guide me.Step 3: Interpreting \(p\)-Values and Critical Regions Socraticly
Once the test statistic is computed, you find the \(p\)-value or compare the statistic to a critical value from a distribution table:
- If the test statistic falls in the critical region (rejection region), or if \(p \le \alpha\), you reject the null hypothesis and conclude there is statistical significance.
- If the test statistic does not fall in the critical region, or if \(p > \alpha\), you fail to reject the null hypothesis. (Never say you "accept the null hypothesis"!)
Use this Socratic prompt to check your interpretation logic:
I have conducted a two-tailed t-test and calculated a t-statistic of 2.15. The critical t-value for my degrees of freedom at alpha = 0.05 is 2.06. Act as a Socratic statistics coach. Do not state the final conclusion. Ask me to compare the calculated t-statistic to the critical value, and prompt me to explain what this comparison means for the null hypothesis and how to state the final statistical conclusion. Guide me.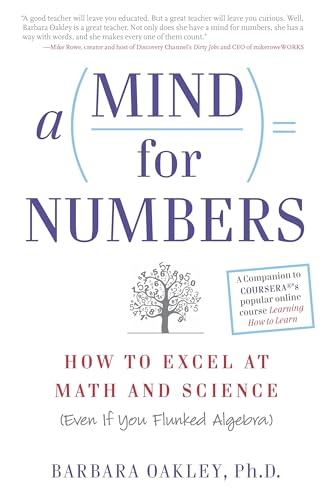
A Mind for Numbers: How to Excel at Math and Science
Dr. Barbara Oakley's actionable guide to unlocking analytical thinking. Perfect for students tackling STEM classes who want to beat procrastination and master complex formulas.
AI Study Pilot receives a small commission from qualifying Amazon purchases at no extra cost to you.Common mistakes
Keep an eye out for these classic pitfalls when studying hypothesis testing:
- Misinterpreting the \(p\)-value: A \(p\)-value is not the probability that the null hypothesis is true, nor is it the probability that the alternative hypothesis is false. It is the probability of seeing data this extreme if the null hypothesis is true. AI tools regularly misstate this definition.
- Accepting the null hypothesis: We never "accept" \(H_0\). Failing to reject \(H_0\) simply means we do not have enough evidence to disprove it; it does not prove that \(H_0\) is true.
- Confusing one-tailed and two-tailed critical values: For a two-tailed test at \(\alpha = 0.05\), the critical region is split between both tails (\(\alpha/2 = 0.025\) in each tail). Looking up the column for \(0.05\) in a one-tailed table instead of \(0.025\) is a highly common student error. Ask AI: "Socraticly quiz me on how to split alpha for two-tailed tests and how to read critical values correctly. Guide me."
FAQ
- What is the difference between statistical significance and practical significance? Statistical significance means the effect is unlikely to be due to chance, but the actual size of the effect (effect size) might be tiny and useless in the real world. Prompt: "Socraticly quiz me on the difference between statistical significance and effect size (like Cohen's d) and why both are needed. Guide me."
- How does sample size affect the likelihood of rejecting the null hypothesis? Larger sample sizes reduce standard error, making the test statistic larger for the same mean difference, which increases statistical power but can make trivial differences statistically significant. Prompt: "Act as a Socratic tutor. Quiz me on how sample size impacts standard error and test sensitivity. Guide me."
- What is a p-hacking warning? P-hacking is the practice of manipulating data or running multiple statistical tests until a statistically significant (\(p \le 0.05\)) result is found. Prompt: "Socraticly quiz me on how running multiple tests increases the family-wise Type I error rate and how to correct for it. Guide me."
Final recommendation
Hypothesis testing is the logical bridge between raw datasets and scientific conclusions. Do not let AI look up your critical values or state your conclusions. Instead, state your null hypothesis clearly, determine your test parameters, check your tails, calculate your test statistic on paper, and leverage Socratic AI sessions to verify your error boundaries and p-value interpretations.
Disclosure: AI Study Pilot may add affiliate links later. We recommend free-first tools where possible and never promise guaranteed grades or outcomes.